RP3 ROWING MONITOR - DIRECT FEEDBACK ON EVERY STROKE
USE THE POWER CURVE
Experience real time feed back with every stroke on the RP3. Use the 'shadow curve' to compare your next stroke shape or set a target curve to imitate.
NUMBERS, METRICS & SETTINGS
Start a quick session or a specific training for your workout. Select to see the usual numbers like split, stroke rate, avg. split and workout time or countdown.
ADVANCED REAL TIME MONITORING
Improve yourself by using stroke length, peak force position, peak force, watts or joules and drive time or recovery parameters to really improve your stroke.

Use the iOS or Android version
DIRECT FEEDBACK WITH RP3 MONITOR
RP3 Rowing did make the decision to provide always be connected’ when doing the workout. Anyone can use a smartphone or tablet with the RP3 App (iOS or Andriod) as rowing monitor. The data is key to get the experience and improve your strokes to become a better rower! Login with your RP3 account in the app to get every workout automatically uploaded into the RP3 Portal after the training, even if you finish earlier. You can manage your workouts and history on the portal, next to doing your reporting and analysis.
The Power Curve
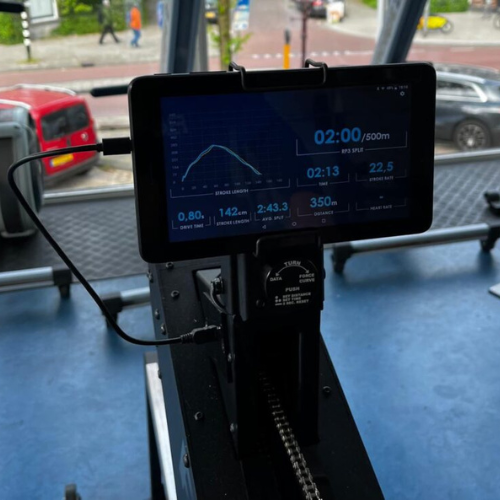
Key function of rowing the RP3 is the Power Curve. The RP3 models are engineered to simulate the rowing movement as close as possible and sensor technology is doing the measurements. The Power Curve is the real time visualisation of your stroke providing a curve that represents the accelaration of the flywheel. So it represents your force in your rowing stroke, simular to the stroke in the boat. See the power curve on the left, blue ‘moving’ line: your actual stroke, yellow: shadow (lastest) or target stroke (based on settings). Y-axis: force (N), X-axis: length (cm)
The Metrics
The other (right) part of the screen is used for metrics and numbers.The iOS app on iPhone provides a selection of three positions on the right of the screen. The standard are:


These could be changed / replaced by a number of other data-fields: Power, Average Power, Stroke Length, Average Split, Distance, Distance per Stroke, Energy per Stroke, Total Energy, Calories Sum, Heartrate, Average Energy per Stroke, Peak Force, Peak Force Position, Relative Peak Force Position, Drive Time, Recover Time, Stroke Time, DR ratio, Speed, K (flywheel resistance or drag factor).
Andriod Tablet Monitor
The tablet option provides more data fields to select. Next to the large “Power Curve” section on the left and the “RP3 Split” on the right (which is also flexible to change), there are 7 fields to select.

DIRECT FEEDBACK ON YOUR STROKE
Most RP3 users, rowers and coaches, are using the RP3 Rowing Monitor get direct feedback and work to improve the stroke. The Power Curve and numbers are providing much information to get the best interaction
and learn fast.
Every single workout can have a different goal, whether you work on the catch, hang, hip-hinge or finish. Shape your best curve and see the ‘room for improvement’. Work on a target (average) stroke length or
the ratio and rhythm, supported by numbers, of your stroke.
RP3 Rowing app is available in Google Play and Apple Store
DOWNLOAD NOW
The RP3 Rowing Monitor is available for Apple iOS and Andriod devices.Although the iOS app on smartphone is doing great, most serious rowers use the Andriod App on a tablet. Here you can select more field to get the right interactive feedback on your strokes on RP3.Go to the Apple App store or use the button below.

TESTIMONIALS
WHAT OUR CUSTOMERS SAY
'Never been fitter or more excited to get on the water!'
Maureen McGuire'I enjoy using RP3, it made winter training bearable due to similar feel to on the water training and, what is more important, safer in terms of back injuries.'
Ozren Tošić Public health docter